The most important scientific achievements for 2011–2020
|
|
|
Fig.
1. HST image of the PGC 9962 galaxy (on top).
Hertzsprung-Russell diagram for this galaxy is shown with isochrones of
different ages (in the bottom left corner)
and number density distribution diagrams for stars of different ages
perpendicular to
disk plane (in the bottom right corner). The numbers on the diagrams
denote the age of stars in millions of years.
|
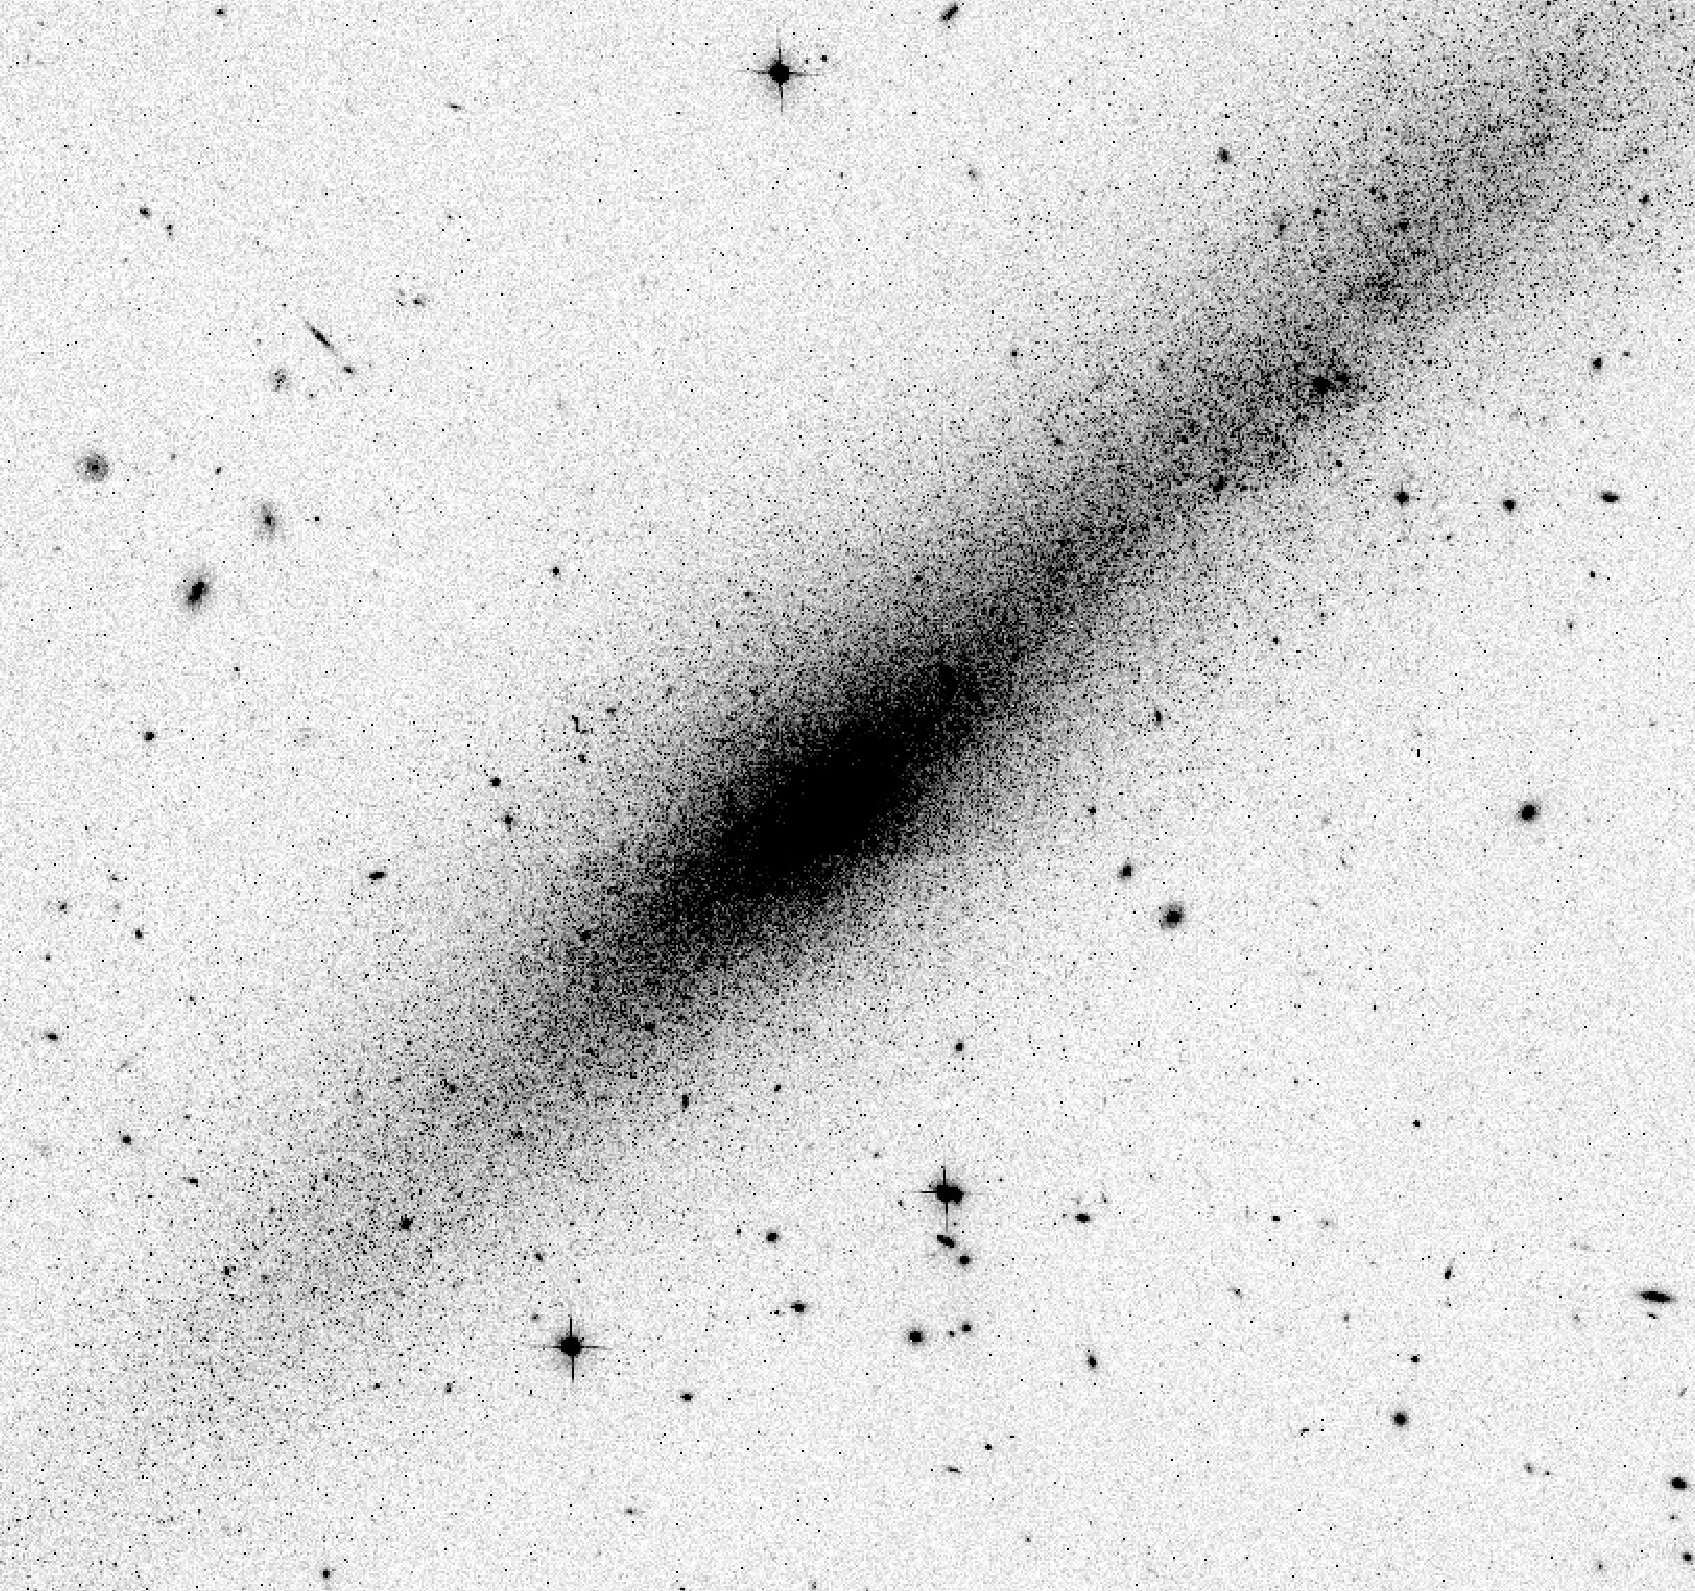
2) The NGC 1313 galaxy, being, perhaps, the most mysterious galaxy of the sky, has been studied based on the Hubble Space Telescope images. In normal images, it looks like a normal spiral galaxy but deep images show that the galaxy is highly distorted by gravitational interaction. However, the images do not show any neighboring galaxy, which would create the deformation of a stellar structure. We made a stellar photometry of eight NGC 1313 fields and of its dwarf companion AM 0319-662 and studied the visible distribution of stars of different ages and of metallicity in the galaxy. It has been found that the spatial distribution of low metallicity stars is substantially different from the distribution of high metallicity stars. This distinction has allowed us to identify the fragments of a dwarf galaxy destroyed by now, being almost merged with NGC 1313. This disappeared galaxy was the cause of the gravitational deformation of NGC 1313. |
|
Tikhonov
N., Galazutdinova O.,
Astronomy Letters, V. 42, Iss.7, p. 428, 201, 2016.
Tikhonov N., Galazutdinova O., Galaxy NGC 1313 mystery (poster), VAK-2017, Yalta, 17 September, 2017. |
|
Fig. 2. Galaxy NGC 1313 (image made with 8 meter telescope (VLT)). |
3) We have developed the new
method for determining the size of groups and clusters of galaxies from
cumulative distribution
of number of galaxies in
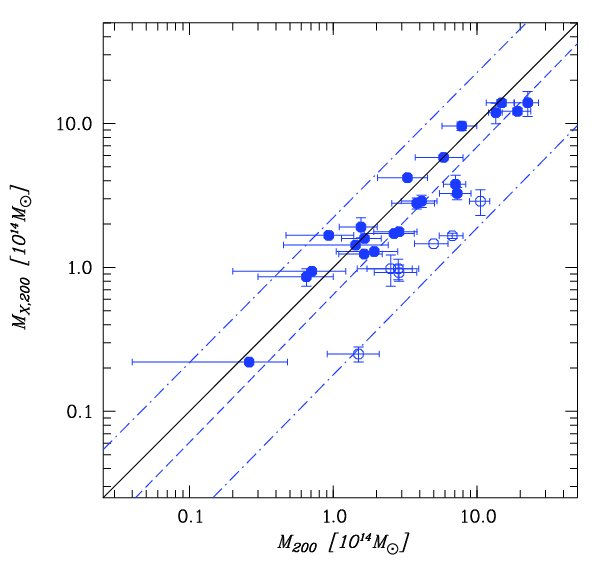
dependence on squared clustercentric distance. For 29 systems of
galaxies we have determined
dynamical masses within the effective radius Re
which are about 1.65 times less then masses enclosed within R200 radius. A
comparison of the
inferred dynamical masses and the
hydrostatic masses determined from the radiation of hot gas in galaxy
groups and clusters (based on
published data) led us to conclude that the inferred masses for the
main sample of 21 groups and clusters, which does not include merging
clusters with irregular structure, the dynamical masses exceed the X-ray masses an
average by
12%, with an rms scatter of
35%.
Kopylov A.I., Kopylova F.G., Astrophysical Bulletin, 70, Iss.3, p. 243, 2015. Fig. 3. A
comparison of
the X-ray masses (MX,200) obtained
by gas radiation in
X-ray band with the dynamical masses (M200)
measured
from the radial velocities of galaxies. The objects of the main sample
are shown by filled circles.
|
|
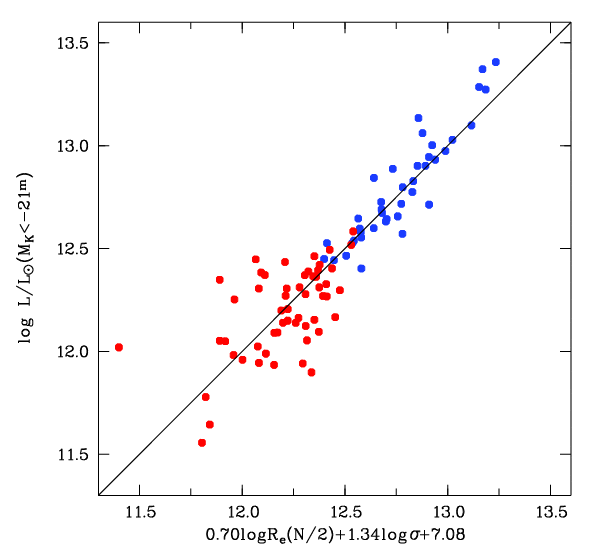
4) We have developed a new method for determining the
size of galaxy clusters, the region with a radius of Rh (or Rsp) (>R200), from the
cumulative distribution of the number of galaxies depending on the
squared clustercentric distance, where Rh (or Rsp)
radius of apocenter of orbits of galaxies. This allowed to determine
for the systems of galaxies the total K-luminosity and
the number of
galaxies corrected for the background. K-luminosity,
effective radius
containing either half of the luminosity, or half the number of
galaxies and dispersion of radial velocities of galaxy systems form a
Fundamental plane (FP) LK = Re0.70(N/2)×σ1.34.
In Schaefer et al. (MNRAS, L21, 263, 1993) (for comparison) for 16
clusters of galaxies in the filter V by another method is obtained the
FP: LV = Re0.89×σ1.28. Fig.
4. The Fundamental plane of galaxy groups and clusters in NIR range.
The regression relation have the form of: LK = Re0.70(N/2)×σ1.34.
The red circles show galaxy groups with σ
< 420 km/s.
|
|
5) Stellar
photometry for three fields in the Virgo cluster of galaxies has been
performed on the basis of archival Hubble Space Telescope ACS/WFC
images. The densely populated red giant branches belonging to cluster
galaxies are seen on the constructed Hertzsprung-Russell diagrams. The
distances to eight galaxies in the Virgo cluster have been determined
by the TRGB method (from
14 to 18 Mpc). The sizes of the stellar subsystems and the gradients in
the number density of red giants along the galactic radius have been
determined for the investigated galaxies. The stellar periphery of the
galaxies has been found to extend to great distances and to cover the
entire area of the images used. Therefore, the stars that have
previously been thought to be intracluster stars actually belong to the
periphery of neighboring galaxies.
Tikhonov N., Astronomy Letters, V. 43, Iss.1, p. 21, 2017. 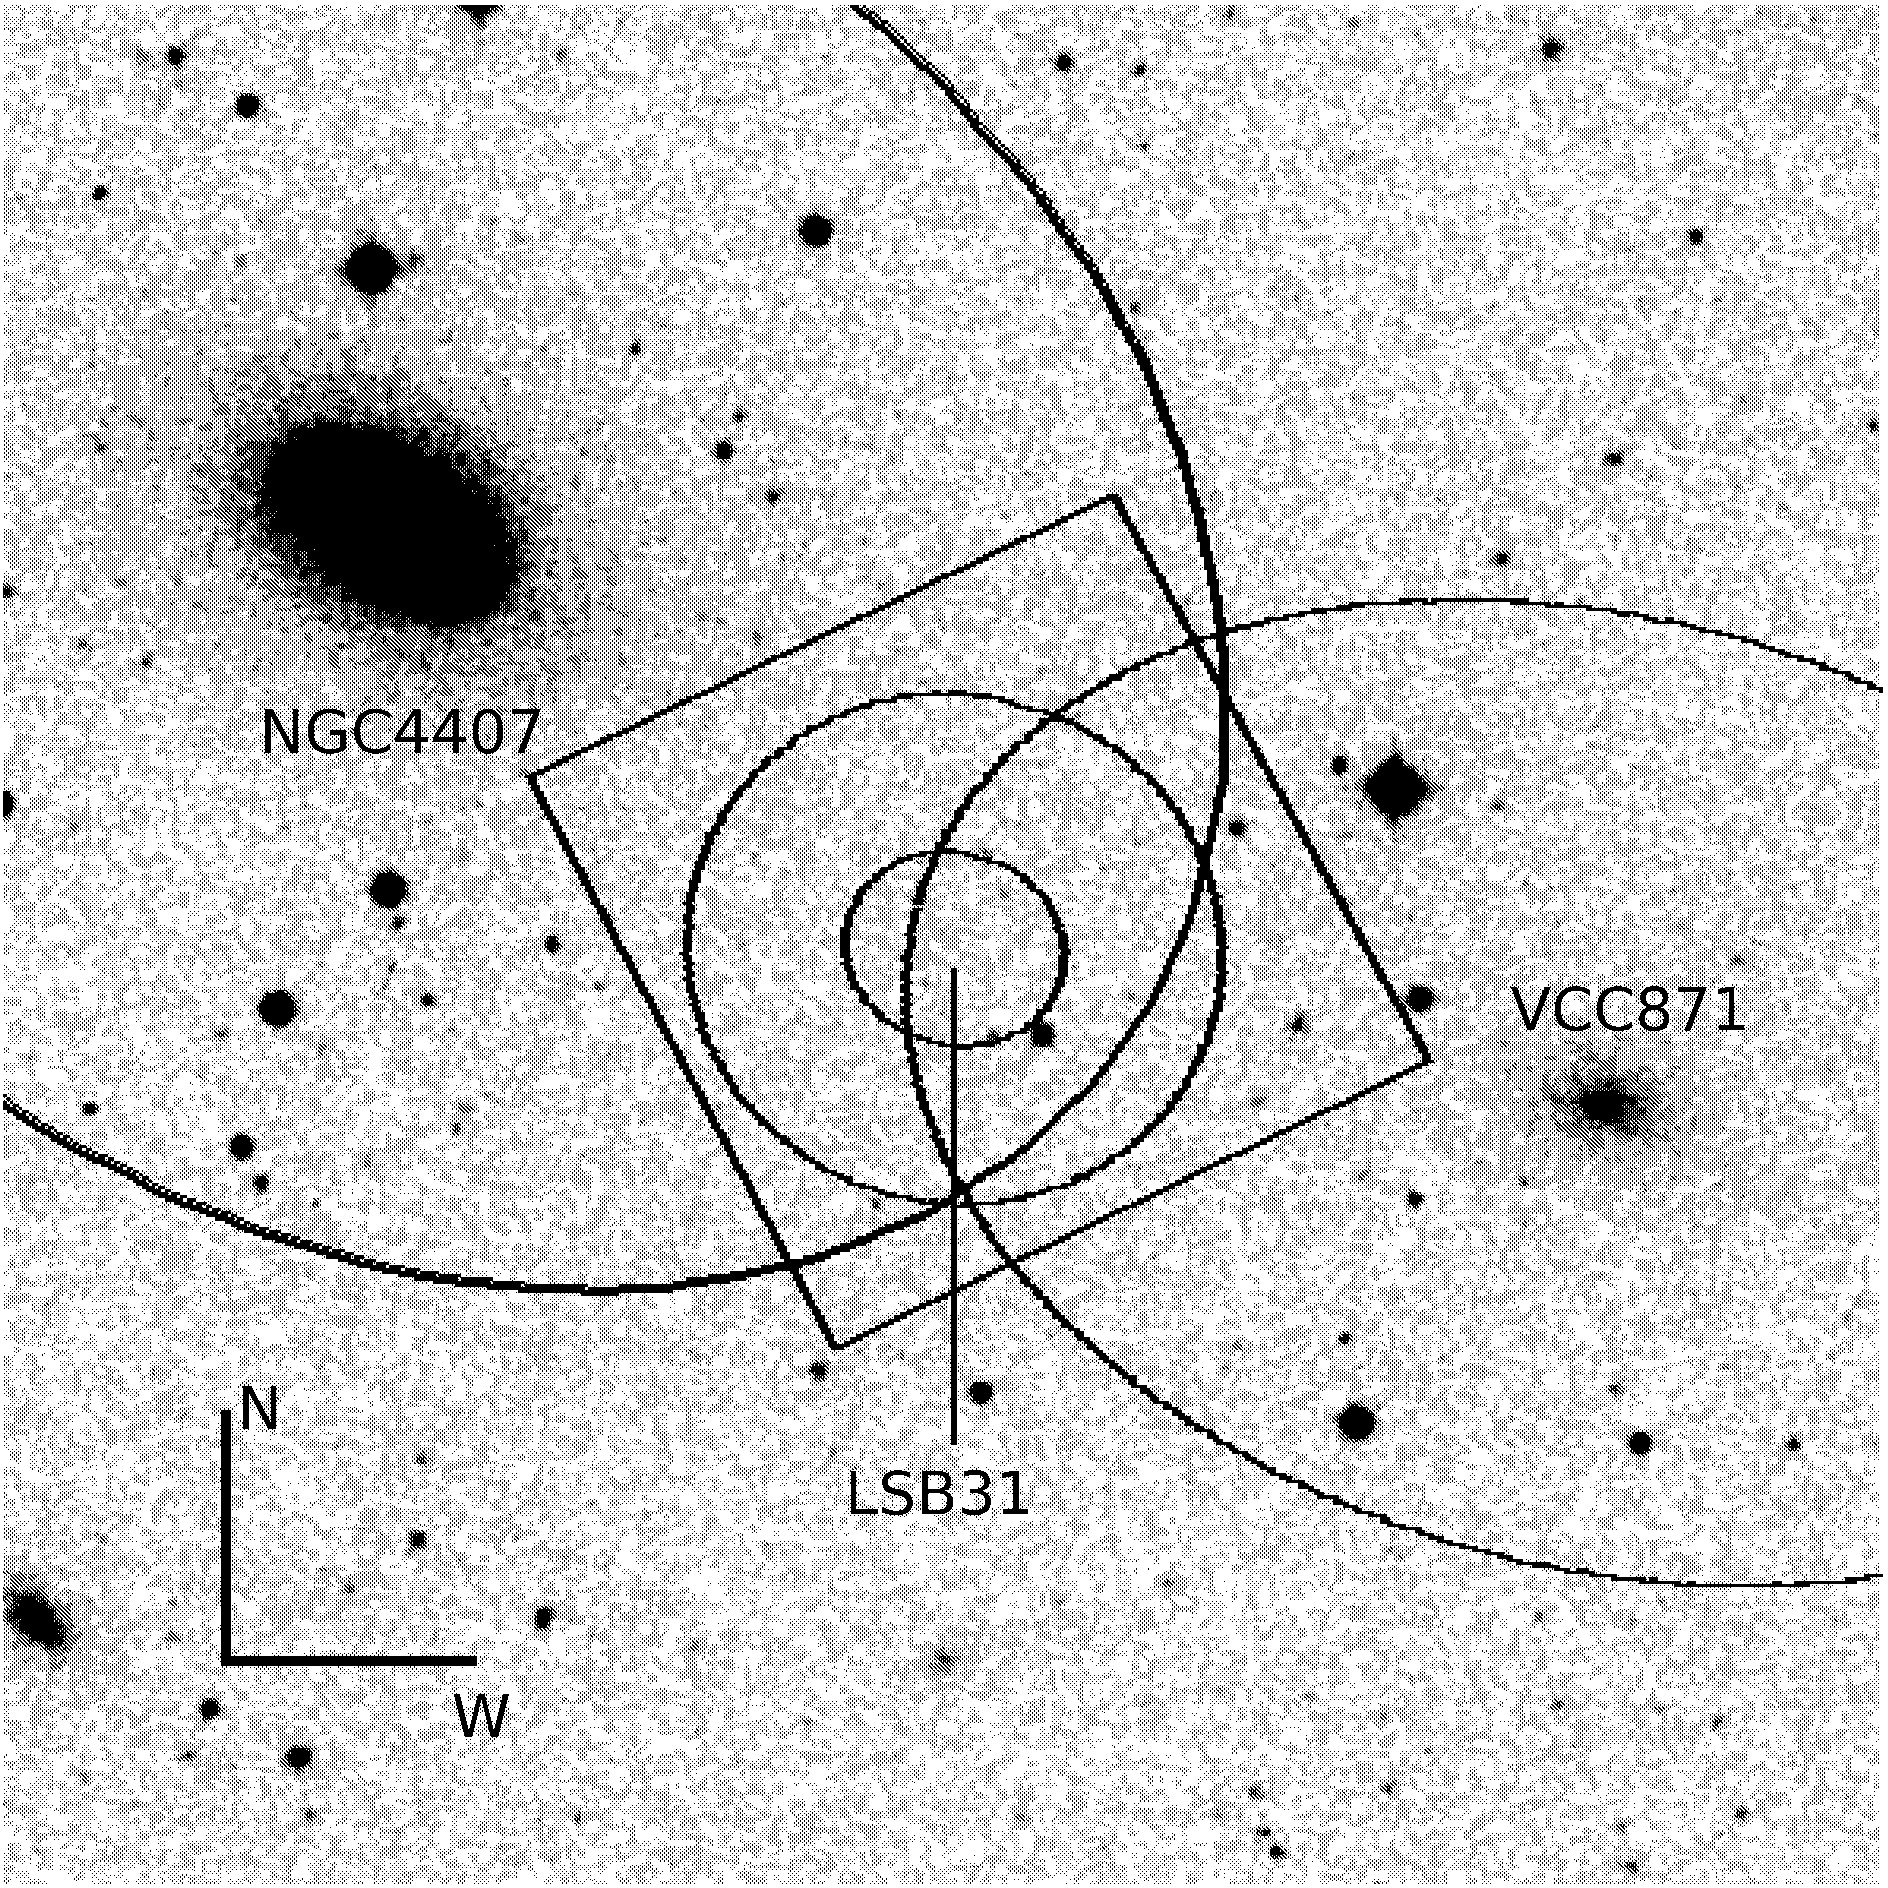 Fig.
5. Image of the galaxies LBS 31, NGC 4407 and VCC 871 in the DSS
review. The square F2 of the Hubble Space Telescope with the ACC/WFC
chamber is noted. The ellipses around NGC 4407 and VCC 871 mark the
visible boundaries of the star subsystems of these galaxies. It can be
seen that the subsystems overlap the HST image of the telescope and
make it impossible to search for intergalactic stars in this field. The
size of the picture is 10'×10', the north is at the top.
|
|
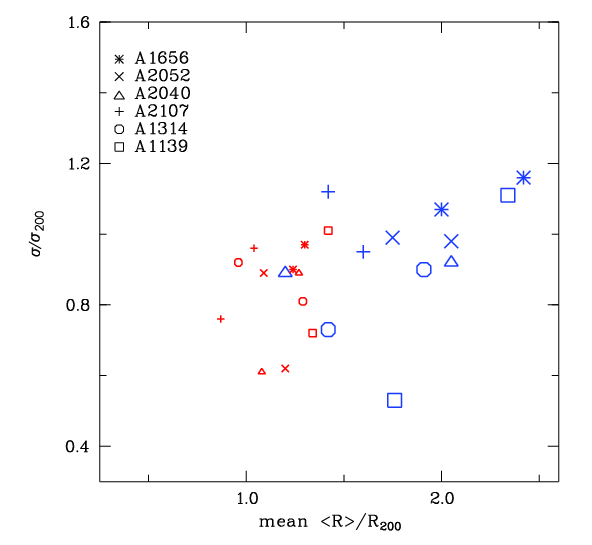
6) According
to the archives of the SDSS DR10 catalogue for clusters of galaxies
A1656 (Coma), A1139, A1314 (Leo supercluster), A2040, A2052, A2107
(Hercules supercluster) the specific star formation rate is determined.
We have obtained that the fraction of galaxies with quenched star
formation decreases continuously with a radius of 0.87±0.02
in the
center to 0.43±0.03 in the outskirts, beyond the Rsp. Thus
remains more, than in the field on average on 26%. We also found that
galaxies actively forming stars are, as a rule, on the outskirts of
clusters of galaxies and have dispersion of radial velocities more than
galaxies with quenched star formation. Fig. 6. Variations of spatial distribution and kinematics of galaxies in clusters depending on their specific star formation rate (log sSFR), divided into 4 bins. The size of the symbols correspond to these bins: large symbols – log sSFR = [–1.75,–1.35], [–1.35,–1.05] Gyr–1, small symbols – [–1.75,–4.00], [–4.00, all the rest] Gyr–1. Thus, large symbols mark the star formong galaxies, small – galaxies with quenched star formation. |
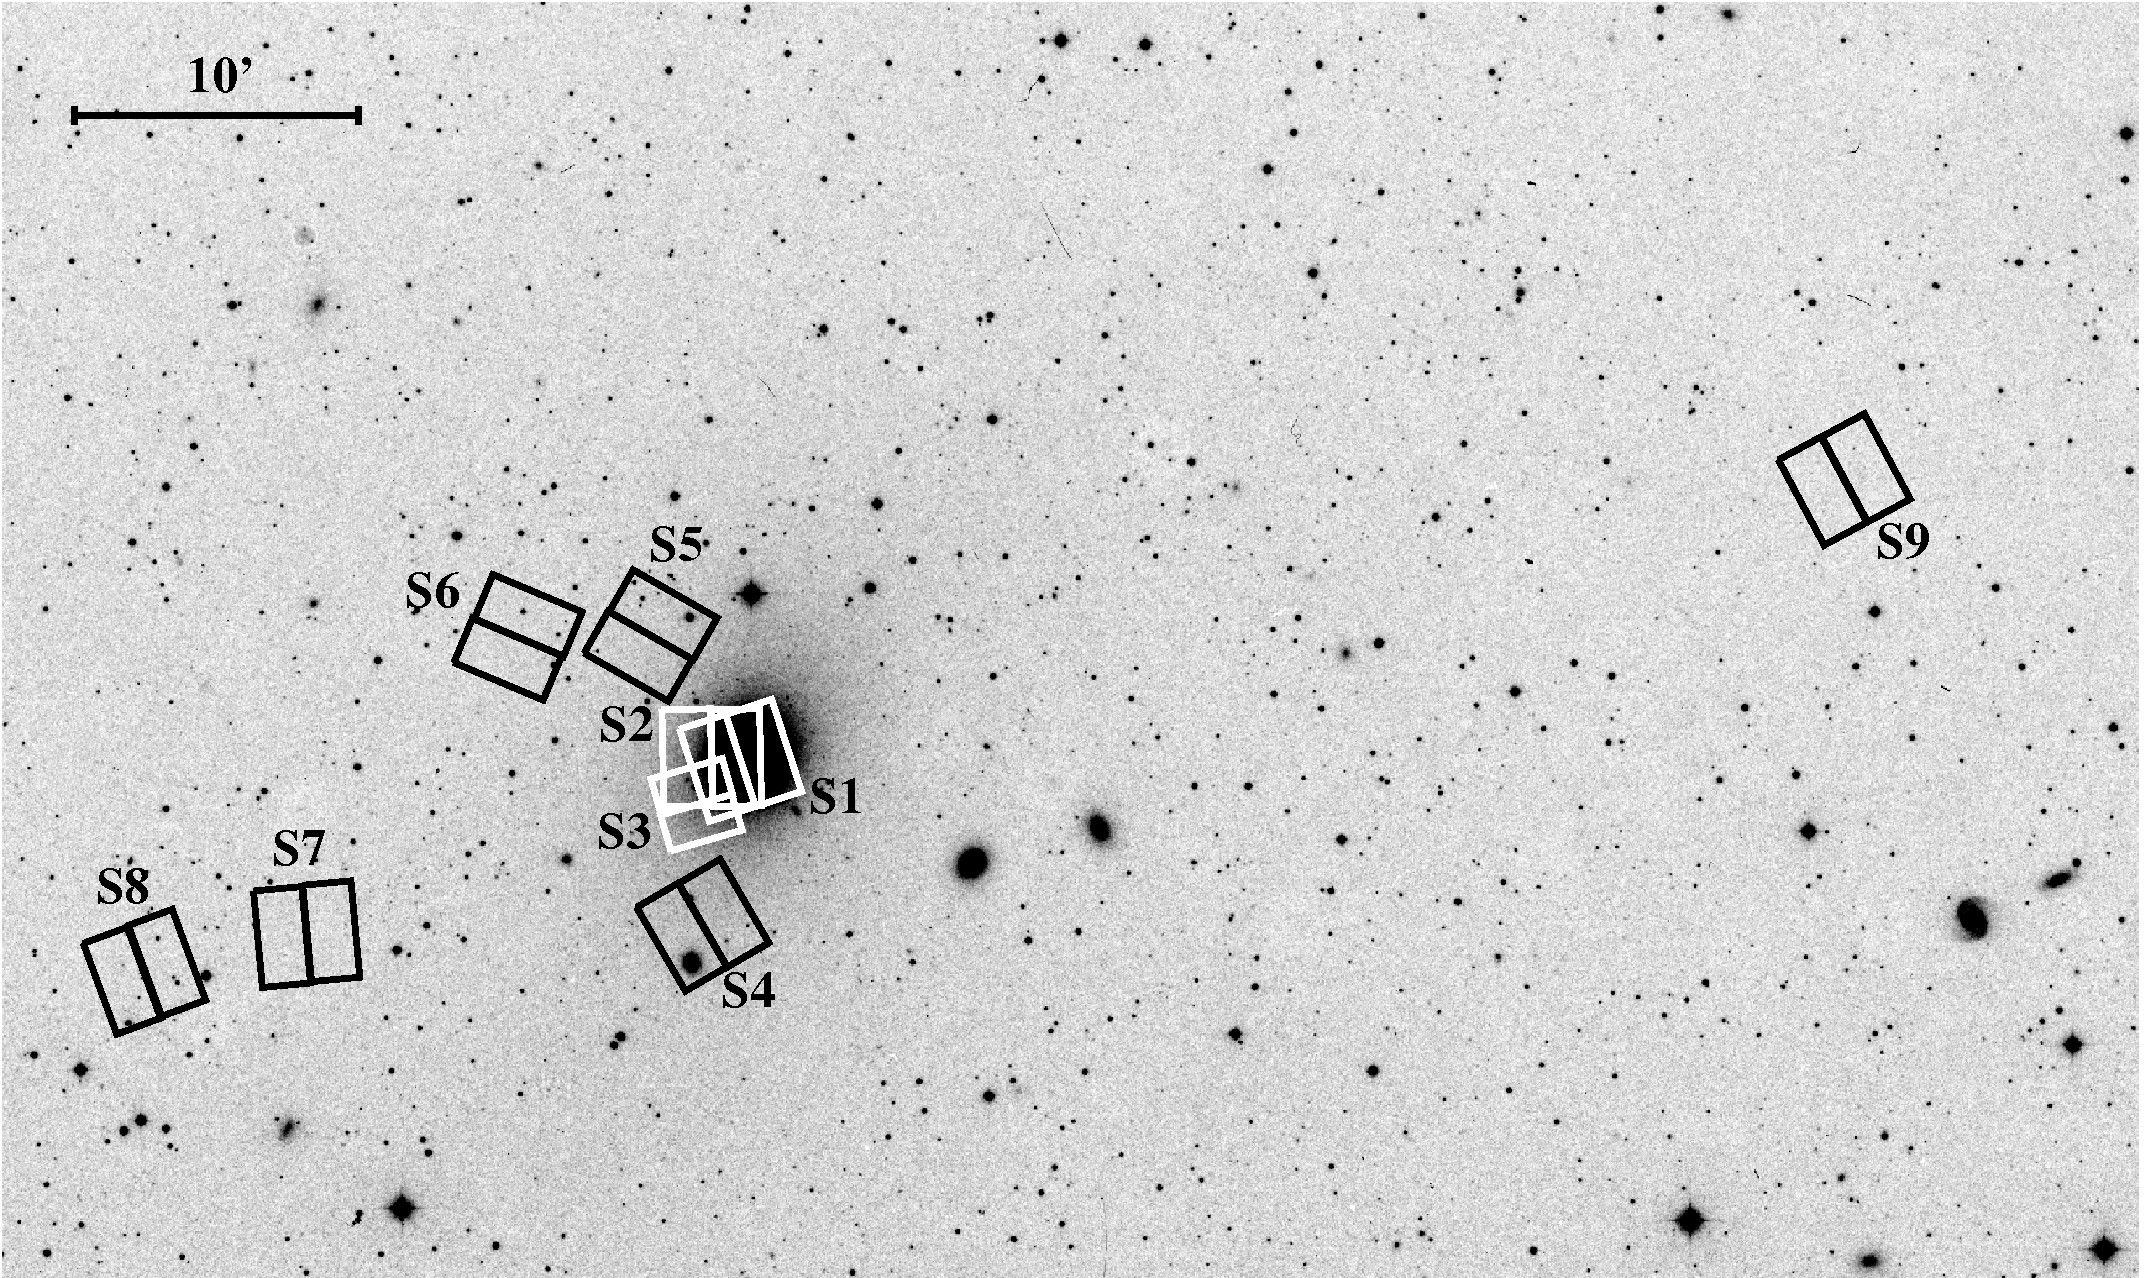
7) On the basis of the Hubble Space Telescope images stellar photometry of nine fields around the giant
elliptical galaxy M 87 from the Virgo cluster was performed to determine the boundary of the influence of giant
galaxies of groups and clusters on neighboring dwarf galaxies.
The populated branches of red giants and AGB stars
are visible on the Hertzsprung-Russell diagrams. Distances to M 87 for each field are determined based on the TRGB method. An
increase in the distance modulus is found when approaching the center
of the galaxy, indicating either the influence of high-metallic red
giants, or the existence of a weak gas-dust cloud around M 87 with a
diameter of approximately 20' and maximum absorption in filter I to 0.18m near the center of
the galaxy. The
average value of the distance modulus was determened
as (m–M) = 30.93 by
the outlying
from the center of the M 87 fields, which corresponds to a distance D = 15.4 Mpc. This
value puts M 87 not in the center of the cluster, but on its near edge. The
star subsystem of the galaxy is defined up to a distance of 190 kpc and
has an even greater continuation. It
is shown that the stars at this distance belong to the galaxy M 87 and
are not intergalactic stars, as previously thought. For
the first time distances to three dwarf galaxies were measured:
P4_anon, NGC 4486A and VCCA 039.These galaxies turned out to be
M 87 satellites.
Tikhonov N.A., Galazutdinova O., Karataeva G.M., Astrophysical Bulletin, 73, Iss.2, p.257, 2018. |
|
8) In order to study the
properties of galaxy clusters,
the properties of galaxies in them and their outskirts, we have
compiled a
sample of the 157 groups and clusters of galaxies in the local Universe
(0.01 < z < 0.10) with 200 < σ < 1100 km s-1. We
have
measured their global characteristics (according to Sloan Digital Sky
Survey data)
and presented in the
Table.
A.I. Kopylov and F.G. Kopylova, Astrophysical
Bulletin, 70, p.243, 2015.
F.G. Kopylova and A.I. Kopylov, Astrophysical Bulletin, 71, p.129, 2016. F.G.Kopylova and A.I. Kopylov, Astrophysical Bulletin, 72, p.111, 2017. F.G. Kopylova and A.I. Kopylov, Astrophysical Bulletin, 73, p.267, 2018. F.G. Kopylova and A.I. Kopylov, Astrophysical Bulletin, 74, p.337, 2019. |
| 9) Based on the archival images of the Hubble Space Telescope we performed
stellar photometry in the infrared and visible ranges in the fields of
the Maffei 1, Maffei 2 and IC 342 galaxies, the light from which
undergoes strong absorption by the interstellar gas and dust clouds of
our Galaxy. The resulting Hertzsprung-Russell diagrams reveal red giant
branches and the positions of their upper boundaries and color indices. A
comparison of color indices of the red giant branch with similar
indices in the galaxies not experiencing extinction made it possible to
determine the amount of extinction in Maffei 1, Maffei 2 and IC 342 as
follows: AV = 3.06, 3.65 and 0.95, respectively. We found
that these galaxies are located at the distances of 6.6, 6.8 and 3.9
Mpc. The values obtained substantially differ from the distances to
these same galaxies (3.4, 3.5 and 3.5 Mpc), measured by Wu et al. in
2014 using the same images. The measurements we carried out show that
Maffei 1 and Maffei 2 do not form a single group with the IC 342 galaxy,
as previously thought. Tikhonov N.A., Galazutdinova O., Astrophysical Bulletin, 73, Iss.3, p.279, 2018. |
